Ribbon
WinDarab menu and toolbars are organized in a Ribbon. The Ribbon is designed to help you quickly find commands and perform tasks. The commands are grouped logical together and placed in a tab. Darab Ribbon consists at least the following tabs:
- Start
- Tools
- Windows
Start
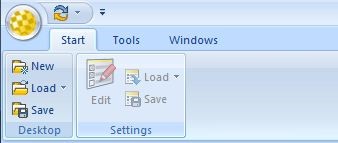
The tool tabs on the Start tab depend on which analysis window is currently active. If no analysis window is opened, the Start tab contains the following tool tabs (see chapter Analysis and Oscilloscope)
- Desktop
- Settings
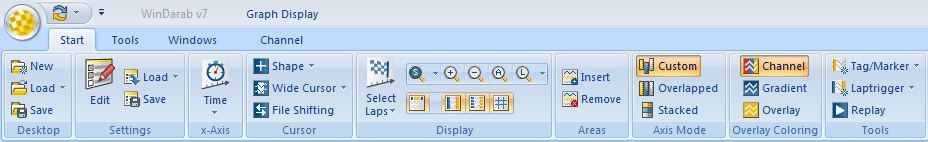
When at least one analysis window is opened the analysis window specific tool tabs will be displayed right of the Settings tool tab.
For example, here are the tool tabs of the oscilloscope:
Desktop
The Tool tab Desktop provides tools for creating, loading, and storing a desktop.
Start → Desktop → New This item will destroy all worksheets and create a new Desktop, with one worksheet containing a single oscilloscope. See Desktop for a detailed description.
Start → Desktop → Load Open the Load desktop dialog box and select the desktop you want to load.
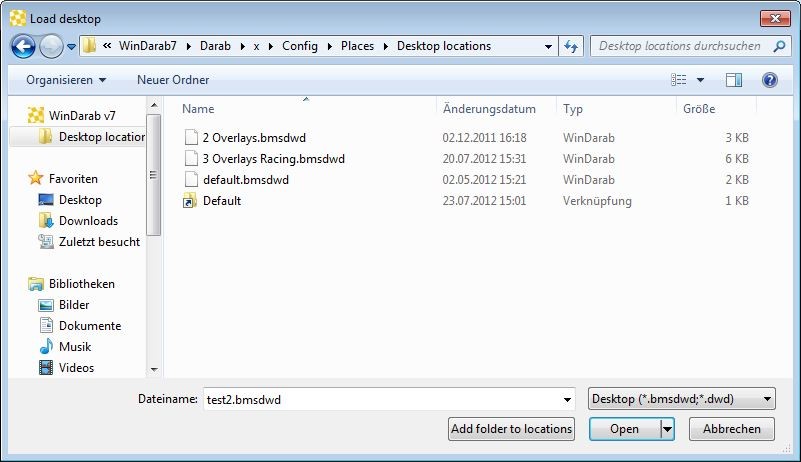
Select the Desktop file.
Click on the Open button.
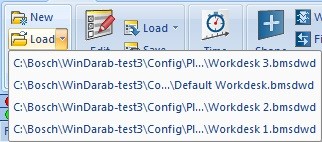
Start → Desktop → Load (Dropdown) You can also open a recently opened desktop by clicking on the dropdown-button right to the Load-button and chose Desktop-file from the list.
Start → Desktop → Save Open the Save desktop dialog box to save the current desktop.
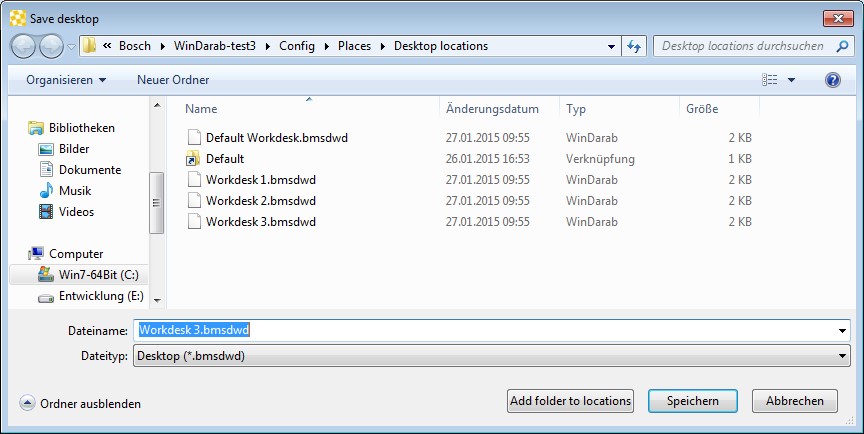
- Navigate to the folder you want to store the current desktop.
- Enter the desktop name in the text field Filename.
- Click on the Save button.
Settings
The tool tab Settings provides tools for editing, loading, and storing of Analysis windows and oscilloscopes settings.
The Settings tools:
Start → Settings → Edit – edit settings of an analysis window or oscilloscope.
Start → Settings → Load - load settings of an analysis window, oscilloscope, or instrument panel.
Start → Settings → Save - save settings of an analysis window, oscilloscope, or instrument panel.
They are described in the chapters Oscilloscope, Analysis, Telemetry.
Tools
The Tools tab contains:
- Mathematics
- Settings
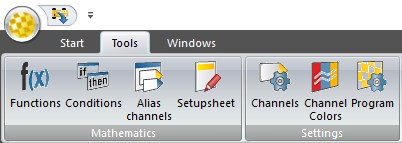
Mathematics
The tool tab Mathematics provides tools for managing mathematical functions and conditions. This will help you to solve a series of mathematical and analytical problems.
The Mathematics tools:
Tools → Mathematics → Functions – allow you to define filters, lookup tables and math functions
Tools → Mathematics → Conditions – allow you to define conditions to exclude certain data from consideration during data analysis.
- This will be deprecated in the future and combined into functions with more control.
They are described in detail in the chapters Mathematical Channels and Conditions.
Additional tools:
Tools → Mathematics → Alias channels - define an alias to another channel.
Tools → Mathematics → Setupsheet - dynamically create channels based on a special file that lives with your data.
Settings
The tool tab Settings provides the possibilities to manage channel settings, channel colors and general WinDarab settings.
The Settings tools:
Tools → Settings → Channels– allow you to define basic settings for each channel in WinDarab
Tools → Settings → Channel Colors – allow you to define the color of each channel in each overlay.
Tools → Settings → Program – allow you to make basic WinDarab settings.
They are described in detail in the chapters Channel Settings and Settings.
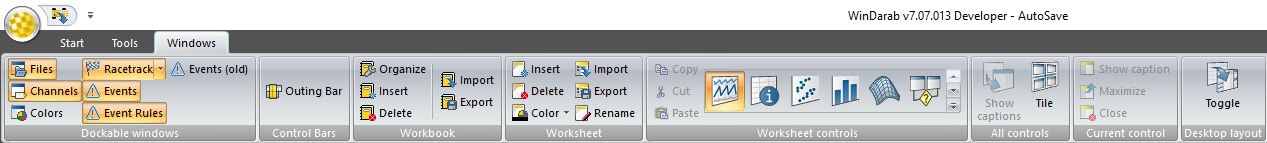
Windows
The Windows tab contains the following tool tabs.
- Dockable windows
- Control Bars
- Workbook
- Worksheet
- Worksheet controls
- All controls
- Current control
- Desktop layout
Dockable Window
WinDarab manages the following dockable windows:
- Files – see chapter File Explorer Window
- Channels
- Colors
- Racetrack – see chapter Racetrack.
- Events (old) – see chapter Events ← this will be depracated/removed in future version.
- Events
- Event Rules
Racetrack
Click with the left mouse button on Windows → Dockable → Racetrack to open a Racetrack window.
The Racetrack window has three different display states. You can select one by clicking on the Racetrack-Drop down button and selecting an item.
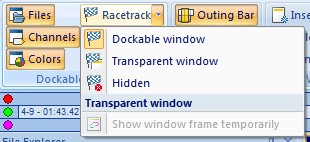
Dockable window
Dockable window is the standard option. In this state, your Racetrack window is docked wherever you chose and can be handled like explained in The Racetrack Window.
Transparent window
The transparent window is activated when you click on it or when you drag the docking racetrack window and drop it somewhere without docking it. As soon as the window loses the focus, its background disappears and all you see is the racetrack.
You can move the racetrack by CTRL + left click and drag to another location.
Alternatively, you can move your cursor over the racetrack and hover for one second to display the background again. Then the racetrack can be moved by dragging the window.
Hidden
The last option is to hide the Racetrack window completely.
Hint:
- You can quickly switch through all the states by clicking on Windows → Dockable windows → Racetrack.
Further Racetrack information can be found at The Racetrack Window.
Channels
Press F3 key to open the Channels Window.
Click with the left mouse button on Windows → Dockable → Channels to open the Channels window.
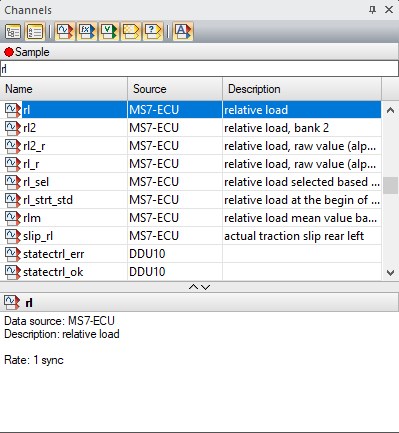
The Channels window displays a list of WinDarab channels. WinDarab channels are divided into the following channel lists:
- Measurements channels
- Math channels
- Virtual channels
- Internal channels
- Temporary channels
The Channels window toolbar allows you to select which channel list should be currently displayed.
The Channels window provides you the possibility to drag & drop a channel to an oscilloscope, analysis window or instrument panel.
The channel list also offers a channel search function. You can find a channel in the channel list by entering the name of the channel in the text field under the window tool bar.
Channel Info
The channel info is a small region under the channel list. In this region you see detailed information about the currently selected channel like the sample rate, the data source, or a selected math channel’s expression.
You can resize the area by dragging the border. You can also max-/minimize it by double clicking the border.
Colors
Click with the left mouse button on Start → Dockable → Colors to open a Colors window.
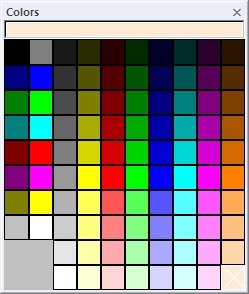
The Colors window provides you the possibility to change the color of a channel, overlay, or something else by drag & drop the color to the corresponding element.
Control Bars
The ribbon Control Bars tab manages the Outing Bar
Click with the left mouse button on Windows → Control Bars → Outing Bar to enable/disable the Outing Bar.
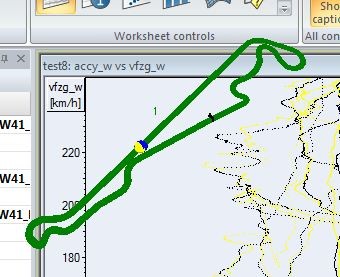
Outing Bar
The Outing Bar gives you an Overview over the Overlays, their laps and the position to each other.

The current visible area is marked yellow; the current cursor position is visualized with a dotted line. When the Area or the Cursor-position changes, the Outing Bar will update automatically.
- Click with the left mouse button on a lap outside the visible area, to set the visible area and cursor-position to the exact position in the lap where it was in the previous selected lap.
- Click and drag the visible area in the Outing Bar to move the visible area in the Oscilloscope. The cursor-position moves with the visible area.
- Click and drag the border of the visible area in the Outing Bar to increase or decrease the Size of the visible area i.e., zoom in/out.
- Double-click on a Lap moves the visible area to the size and the position of the selected Lap i.e., zoom to lap.
Workbook
The ribbon Workbook tab allows you to
- Organize your workbooks.
- Insert a new workbook.
- Delete a workbook.
- Import / Export a workbook.
Worksheet
The ribbon Worksheet tab allows you to:
- Insert a new worksheet.
- Delete a worksheet.
- Rename the worksheet label.
- Change the color of the worksheet tab.
- Import / Export a worksheet.
Worksheet controls
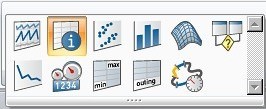
WinDarab manages the following worksheet controls (windows):
- Oscilloscope
- Inform
- x/y-Plot
- Histogram
- Distribution
- FFT
- Flow Chart
- Min/Max-Table
- Outings report
- Lap Analysis
- Instrument Panel
The tool tab Worksheet controls allow you to open one or more worksheet controls.
- A worksheet control could be an oscilloscope, analysis window, inform window or instrument panel.
Hint:
Click and drag a symbol with the left mouse button onto your workspace to open the corresponding worksheet control.
All controls
With the All-controls tab, you can change the caption for all your worksheet controls and tile all of your active worksheet's analysis windows.
- Click with the left mouse button on Windows → All controls → Show captions to show/hide the caption for all your worksheet controls.
- Click with the left mouse button on Windows → All controls → Tile to make all analysis windows on the current worksheet be tiled to the same dimensions.
Hint:
- When you hide the caption of a single window while your other windows still have the caption shown, the Show captions button will be unchecked. You can click on the Show captions button now to show all captions again or press the button two times to hide all captions.
Current control
The Current control tab allows you to adjust the current active control.
- Click with the left mouse button on Windows → Current control → Show caption to change the visibility of your current active control.
- Click with the left mouse button on Windows → Current control → Maximize to toggle between the normal size and the maximum size of your current active control.
- Click with the left mouse button on Windows → Current control → Close to close your current active control.
Hint:
- These functions can also be used by right-clicking on a windows caption-bar and selecting the item from the context-menu.
Desktop layout
Click with the left mouse button on Windows/ Desktop layout/ Toggle to toggle between 2 different desktop layouts.
Hint/Hidden Gem:
- When you click on Toggle for the first time, the docks won’t be visible. You can now adjust your workspace. Both workspaces will be saved when you close WinDarab, so they are still the same after the next start.
- This is commonly used as a 'Setup' layout and an 'Analysis' layout.
- Setup = Get your plots setup the way you like, load data, etc.
- Analysis = remove any extraneous windows and just look at data with maximum screen pixels