How Flow Charts Work
In this section, you will get a brief idea how flow charts work – and the way you have to think to analyze data with flow charts successfully.
To illustrate this, we will start with a simple example.
We want to colorize the racetrack with those sections, where the engine revolution is greater than 7000 rpm until it drops below 6500 rpm. The input data should be the current lap (the lap where the cursor is located in).
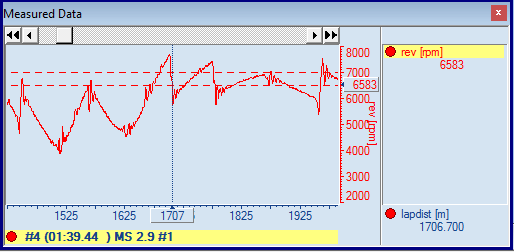
Here is an oscilloscope view of the input data (It is not the whole lap):
The “human” way
Here is what you would do, if you want to colorize the racetrack with the sections of revolution above 7000 rpm:
- Start at the first sample of the current lap.
- Get a blank paper sheet (with the template of the racetrack).
- Look for the first/next sample with “rev” above 7000 rpm.
If the end of lap is reached, the analysis is done! - Get the current lap distance “lapdist” and start with colorizing the racetrack.
- Search for the following sample with “rev” below 6500 rpm.
- Colorize the racetrack between the start positon (found in 3) and end position (found in 5)
- Continue to search for all occurrences by repeating step 3-7. Quite simple, isn’t it?
The “flow chart” way
Now let us see, how this example is realized as a flow chart analysis.
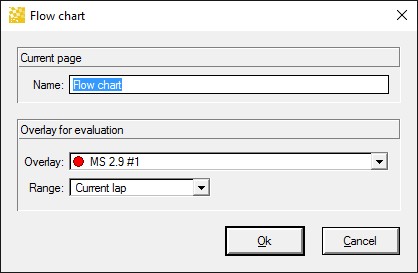
First, after opening a new flow chart window, you should setup your data source (Settings / F5).
In our example, we want to evaluate the current lap of some file:
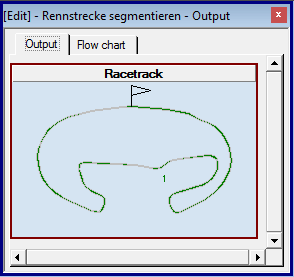
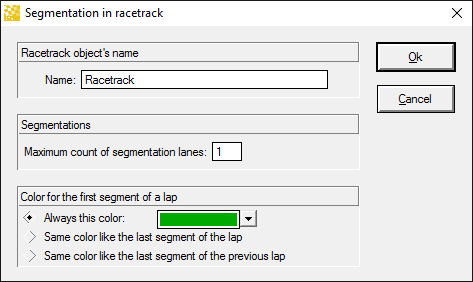
The next step is to insert a racetrack view object on the output page:
|
|
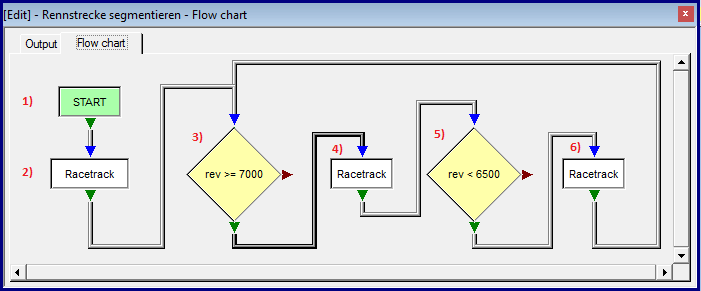
And the last step is to create the flow chart, which looks like this – actually exactly the same as described in the “human” way.
|
|
|
1 |
| START is the entry point of the flow chart analysis. |
2 |
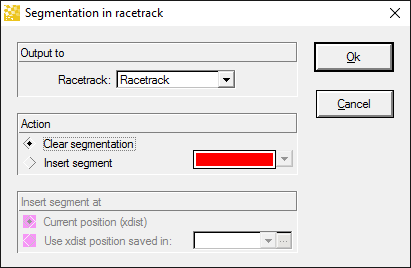
| This “racetrack” object clears the current racetrack segmentation (which is located on the output tab) |
3 |
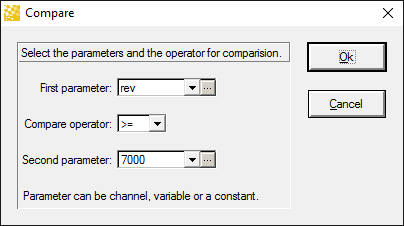
| The condition node “rev >= 7000” instructs the flow chart to look for the next sample where the condition get true. |
4 |
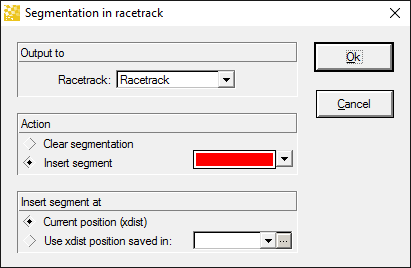
| The racetrack object inserts a segment change (start of segment “Red” – “high rev”). |
5 |
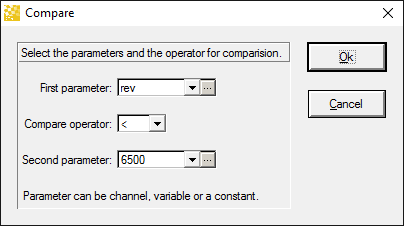
| The condition node “rev < 6500” instructs the flow chart to look for the following sample, where the revolution drops below 6500 rpm. |
6 |
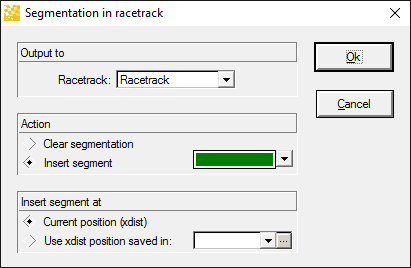
| Now the next racetrack objects inserts the next segment change (start of segment “Green” – “rev normal”) and go back to step 3. |

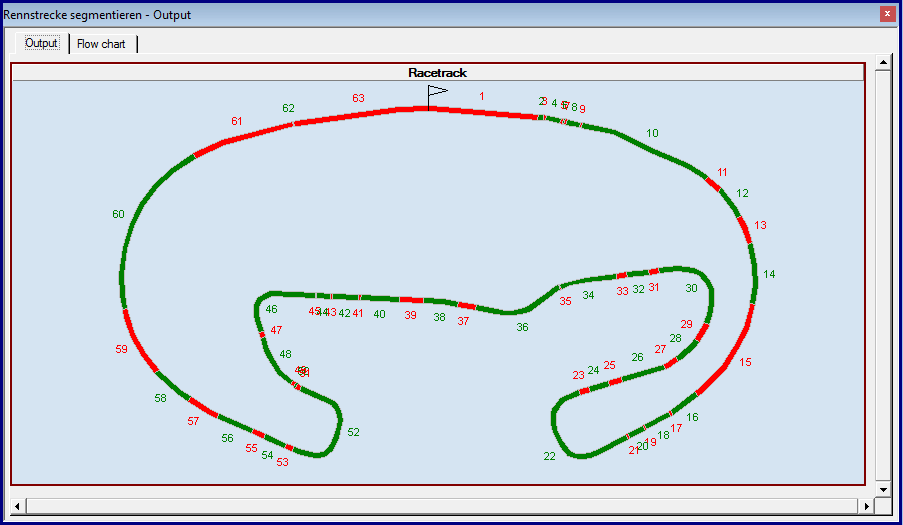
You do not have to mention in a flow chart when to stop the analysis (but you can in special cases!). A flow chart will always stop at the end of the selected data range (or never, if using with telemetry data). After running the flow chart (by disabling the “design” mode), you can see the analysis result in the output window: