Flow Charts
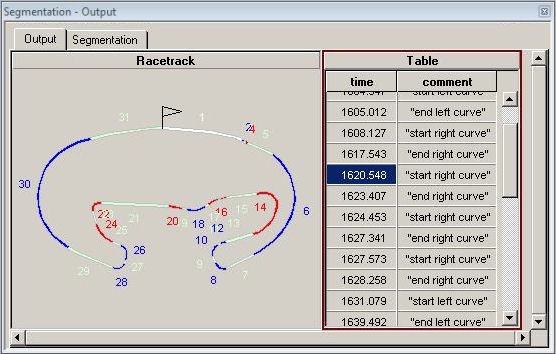
A Flow Chart is a powerful tool with which you can filter and analyse data. For a rudimentary example, you can make left curves as red segments and right curves as blue segments on a racetrack like below.
In flow charts, you have flow-objects like compare, formula, range, print value in table or value, insert/delete segment in a racetrack and others. The flow-objects have parameters: constants, user defined variables or channels.
The way that WinDarab should analyse the recorded data is described systematically in a flow chart – comparable to a state machine.
In the picture below, you can see a part of the flow chart used to create the above example:
