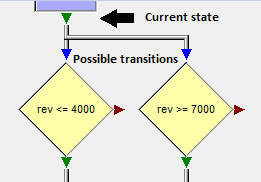
| A flow chart is a combination of state machine and its evaluation rules.
In a state machine “nodes” represent the states and the “links” or ”lines” describe the possible transitions between the states.
In flow chart the “exit” of a node (which was passed last) represents the current state and the nodes linked to the exit are the possible transitions for continuation. |
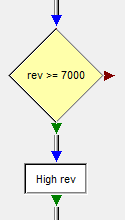
| The flow chart will move forward in the data until:
- a node connected to the current state (exit) evaluates to one of its exits or
- the end of the data evaluation range is reached.
Normally you don’t have to care about proceeding the walk through the data.
In the left example you can see, that it’s not required to connect the false exit of the condition with its entry. In real this would be worse: See next example! |
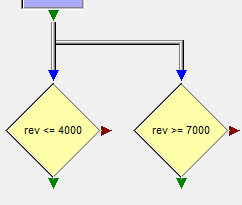
| Correct Usage:
In case you want to test for alternatives create multiple links between the exit of a node and the entries of multiple nodes:
Flow Chart will check both “rev <= 4000” and “rev >= 7000”. As long as both are “false”, Flow Chart will move forward in the data. If one evaluates to “true”, Flow Chart will transit the current state to the corresponding “true” exit. |
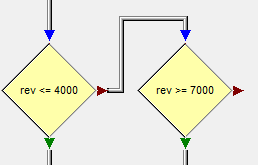
| Incorrect Usage:
This is not correct for checking alternative routes: If “rev <= 4000” is false, the flow chart will transit to the “false” exit of “rev <= 4000”:
Flow Chart will wait for “rev >= 7000” and won’t check “rev <= 4000” anymore! |
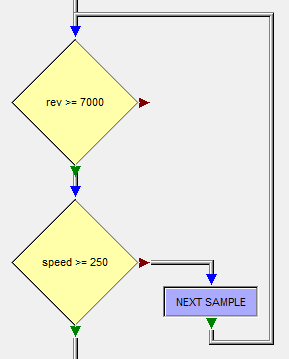
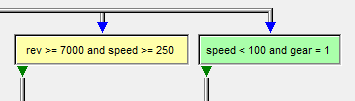
| If you want to check for two conditions to be true at the same time, you have to take care to proceed walking through the data.
Omitting the “NEXT SAMPLE” object in the left example a short circuit would be the result. The flow chart will stuck at the first sample where “rev >= 7000” is true and “speed >= 250” is false! |
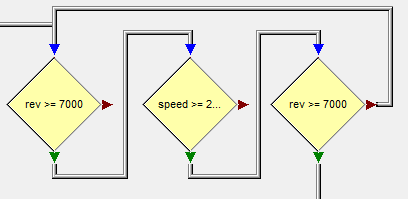
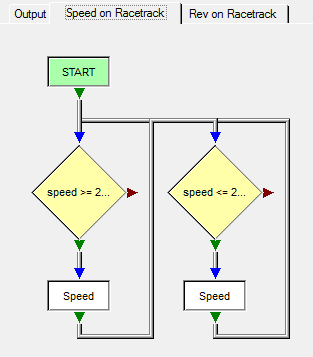
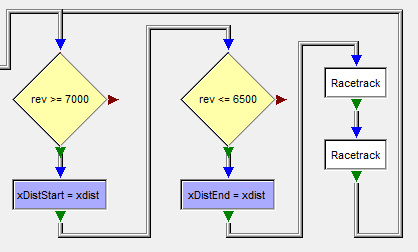
| A better performance can be reached, if you find a flow chart solution without using “NEXT SAMPLE”.
The example above was changed to test “rev >= 7000” again after “speed >= 250” got true.
If “rev >= 7000” isn’t true any more, you can return to the begin of the sequence - and “NEXT SAMPLE” is not required anymore.
This is more performant, but less readable. Use at your discretion |
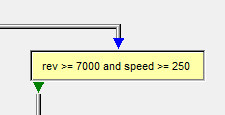
| The more conditions you have which should be “true” at the same time, the more complex this check will be.
It may be resonable to place the condition check into a container. It makes the main flow more readable ! |
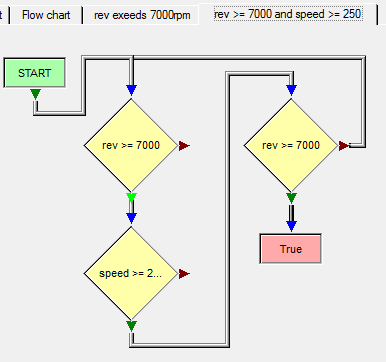
| Note: A container can provide any (reasonable) number of “EXIT” objects. |
| A container has its own internal state. This means the outer flow chart state won’t transit inside of the container. The outer state will only transit to the exit of a container, if the container flow inside reaches an “EXIT” object (on the left the “True” node).
Use parallel containers if you need a complex logic to decide on which path the evaluation has to continue. |
| Use multiple “main” flow chart tabs, if you create multiple indepentent flow charts, which use the single output tab for their results.
Note: You can use containers also but they aren’t designed for this pupose! |
| In case you want to test for alternatives create multiple links between the exit of a node and the entries of multiple nodes:
- Flow Chart will check both “rev <= 4000” and “rev >= 7000”. As long as both are “false”, the Flow Chart will move forward in the data.
- If one evaluates to “true”, Flow Chart will transit the current state to the corresponding “true” exit. |
| This is not correct for checking alternative routes: If “rev <= 4000” is false, the flow chart will transit to the “false” exit of “rev <= 4000”:
The Flow Chart will wait for “rev >= 7000” and won’t check “rev <= 4000” anymore! |
| It’s a good practise to use variables to store information and to separate (a little bit) between output objects and analysis logic.
This can be helpful to organize the flow chart but also to be able to add additional logic (e.g. logic to supress events because of their duration). |