Output Page
This page contains analyzed or filtered results, calculated during flows run. The result can be a simple value, multiple values organized as a table, virtual channels from table columns, or segments in a racetrack.
Output Table
|
|
Insert/Table | During calculations, you can print different values in cells of the Output table. |
Context Menu/ Settings -Or- F5 | If the object is active (with red frame), you can open and modify its settings. You can open the “Output Table” dialog box using the context menu by pressing right mouse button. |
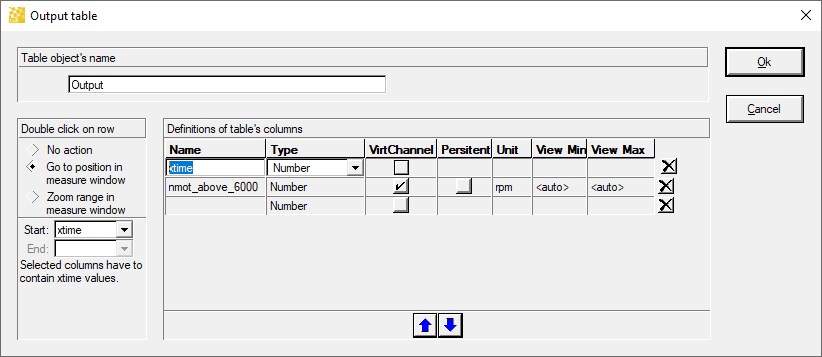
| A row in the Column Definition Table contains the Name and the Type of the column. If the column is a number then you also can choose the length and the decimals of the number. You can change the order of columns with Up / Down arrows. |
Columns as Virtual Channels | Virtual channels can be created from columns in the output table, check the 'VirtChannel' box. These virtual channels can be made persistant (meaning they save to the file), check the 'Persist' box. You can then set the unit, minimum view range, and maximum view range. |
Add Column | A new row is added if you enter a name into the last empty row. |
| If you want to delete a row, then make the row current and then press the delete button. |
Zoom range in measure window | If you want to be able to double click on the output table and zoom an oscilloscope, define two columns (Start and End) |
Go to position in measure window | If you only define a Start, set the radio button to 'Go to position in measure window' and when you double-click the row in the output table only the cursor will move. |
Sorting | You can sort the results of the table by a clicking on the column heading of the table. By default after calculations the results are sorted by the column chosen in the field Start (In our example it is Time column). If you click on other column results will be resorted and the new sort column will be remembered and after next calculations will be used to sort the results. If there are several results with the same value for current sort column then they will be sorted by the values of column in Start field. |
Maximum Rows | The table cannot contain more than 10000 rows. If there are already 10000 rows, the new rows will be ignored. |


Output Value
|
|
Insert/Value | During calculations you can print a value in Output Value, and after the calculation you can analyze it. |
Context Menu→ Settings | If the active object has a red frame, you can open and modify its settings. |
| If you select the check box “Value is a time value”, this means that the printed value is a time and with double clicking on it, the bounded Oscilloscope will go on this time position. |
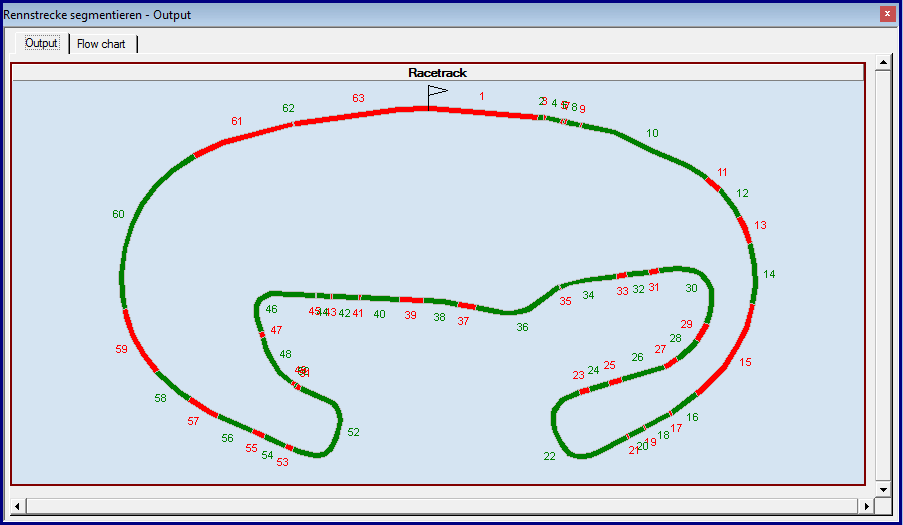
Output Racetrack
|
|
Insert/Racetrack | During calculations, you can insert segment, delete segments or delete all segments in an Output Racetrack. |
Local Menu→ Settings | If, the object is active (with red frame), you can open and modify its settings. You can open the dialog box using the context menu with pressing right mouse button. |
Flow Chart: output can be virtual channels
- Columns in any output table can be enabled to create/populate a virtual channel. The virtual channel can be used in any other view of WinDarab for futher analysis.
- Peristent channels are also supported for single files (not linked files and not telemetry), but only if the evaluation “Whole file” is selected for the flow chart. Note: Be aware that persistent channels are replaced each time the flow is executed!
- The name of the column is used as the name of the virtual channel and the name of the table is used as the data source. Nevertheless to prevent name conflicts we encourage the use of „unique names“. WinDarab will resolve channel name conflicts** nevertheless depending on the execution order of Flow Charts the name conflicts aren’t always resolved the same way!
Setup of the Output Table:
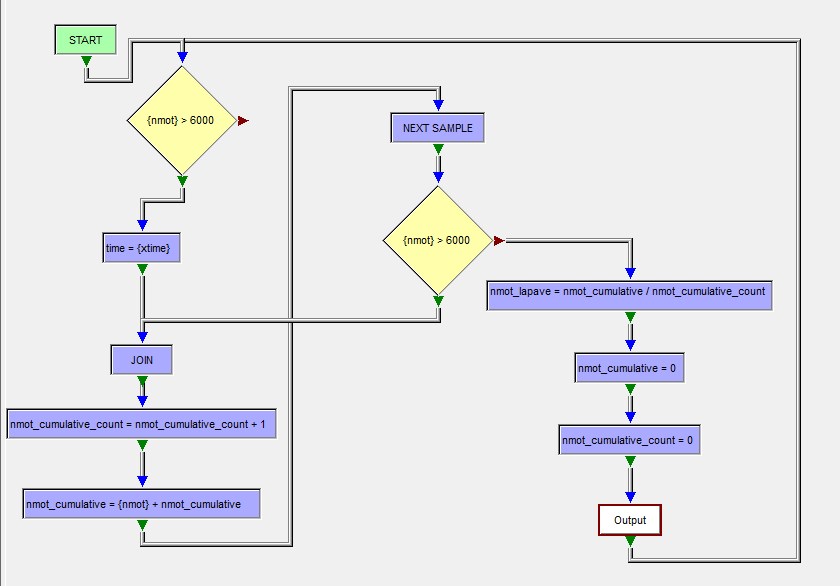
Example Flow chart (calculate the average engine rpm (nmot) above 6000 rpm):
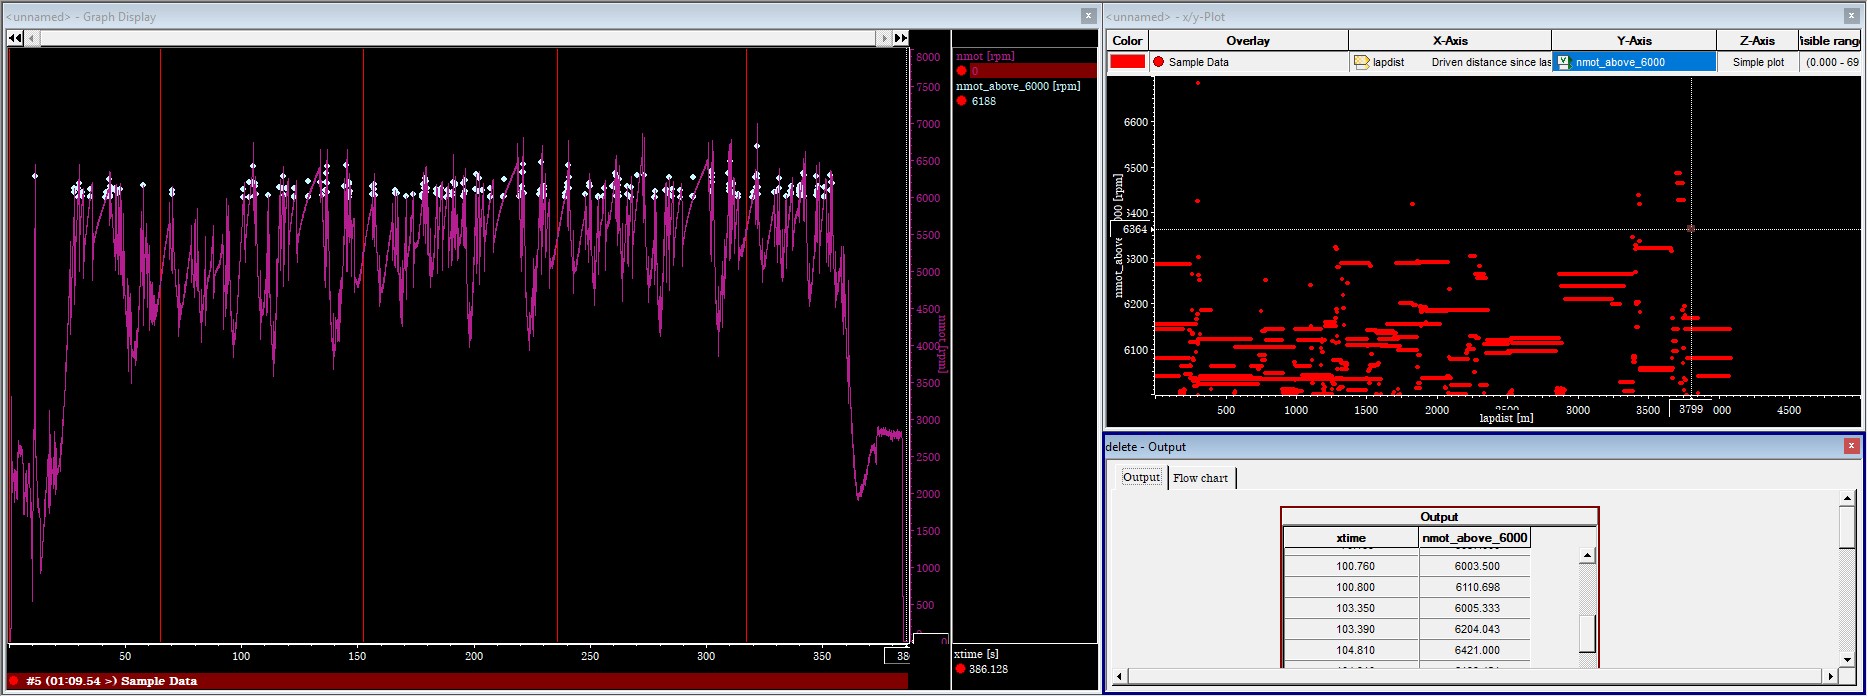
Example Output (oscilloscope and XY Plot):