More Examples
Channel Limit Violation
The following flowchart can be used to check a channel for limit violations. Every limit violation is reported to a data table on the output tab containing the channel name, timestamps, duration and the min/max value.
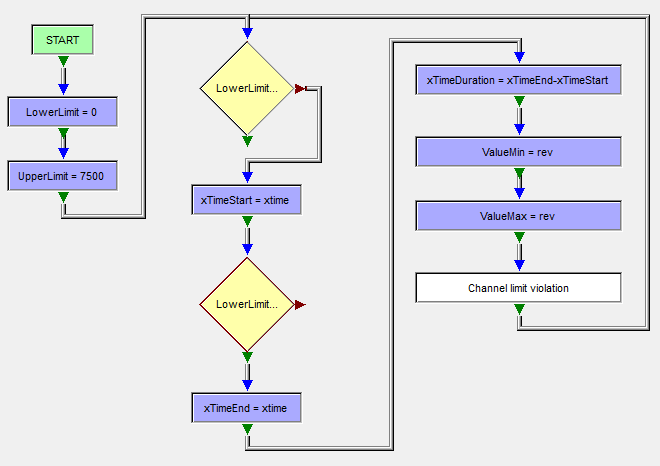
The upper and lower limit for the limit violation check is initialized at the beginning of the flowchart and can be easily modified. The output table is designed to show violations of multiple channels. You can copy and modify the flowchart for each channel you want to observe - but you have to replace the channel in several objects.
Note: ValueMin is calculated as the minimum value of “rev” in the time range xTimeStart to xTimeEnd
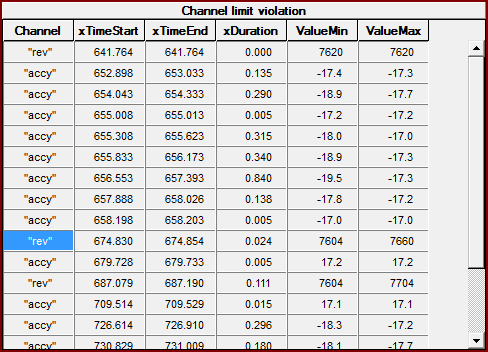
Here is the result table of two flowchart evaluationg “rev” and “accy”.
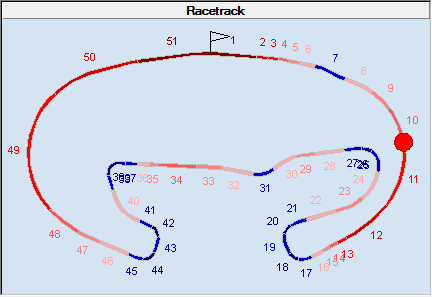
Colorize a Racetrack by Channel Value
This flowchart uses a “Select Case” object to categorize the current speed into zones and creates appropriate segments for a racetrack element on the output tab.
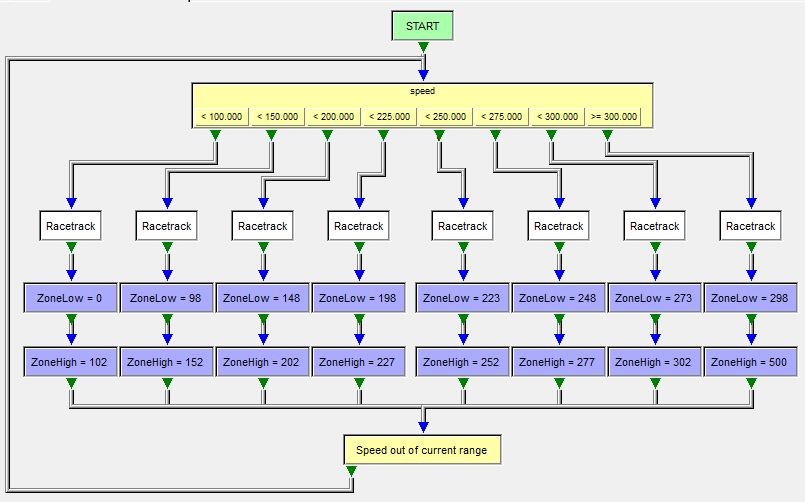
If a zone is entered, the racetrack segment is created and two variables are set with the limits of the zone (2 km/h are added to avoid jitter). As soon as the current speed goes outside of the limits, the loop begins for new. Here is the result of the flow calculated for the current lap: