Plotting GPS with a Maps Background
GPS data can be plotted, with a maps background, using an XY plot. Follow these steps to plot GPS data with a maps background:
- Open a new XY Plot
- Plot the GPS data
- Select the data file with the gps data for the Overlay
- Select the longitude GPS data channel for the X-Axis
- Select the Latitude GPS data channel for the Y-Axis
- Screen capture a map of the track
Here is a possible method for obtaining the screen capture:
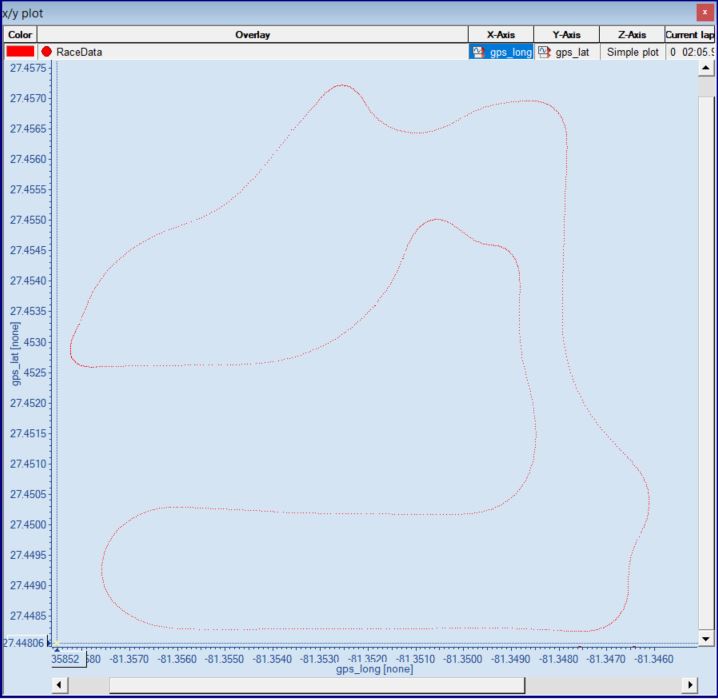
- Zoom all of the way out on the plot of the GPS data in WinDarab
- Note the range of the both axes (more specifically, note the coordinates of the bottom leftmost point and the coordinates of the upper rightmost point)
- Open Google Earth on a Web Browser
- Open the search box (press the magnifying glass on the left side of the screen)

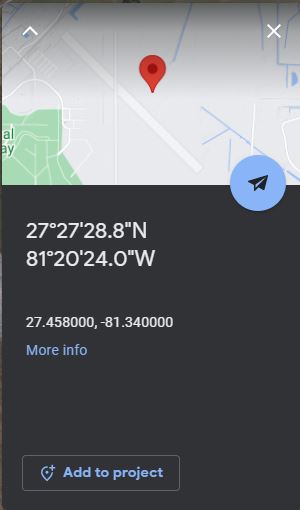
- Enter the coordinates of the bottom leftmost point in the search bar

- Click Add to project in the pop-up to save the mark
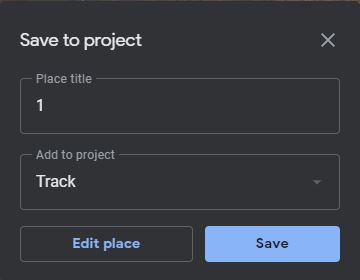
- Choose the name and project that you want to save the marker as, and click Save
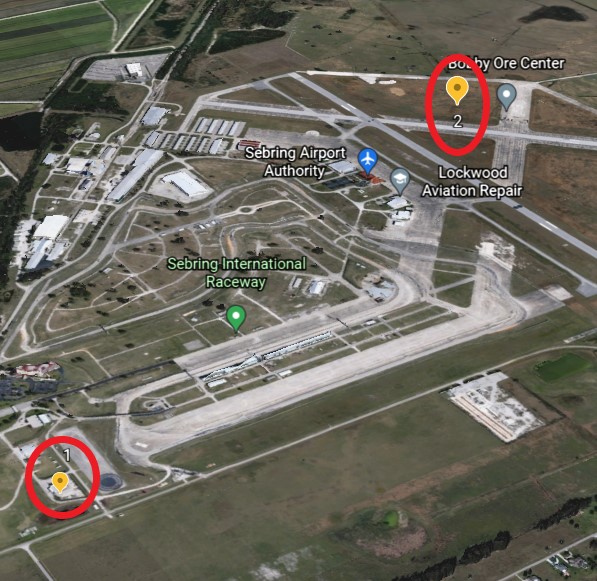
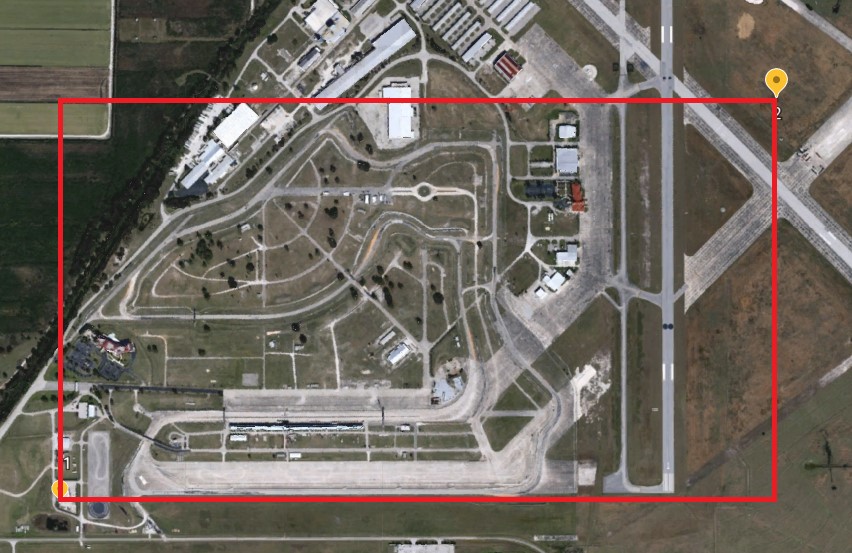
- Repeat the last four steps for the coordinates of the top rightmost point. Once completed, there should be two marks on the map, marking the location of the corners of the GPS data plot.
- If needed, press the 2D icon, as well as the compass icon in the bottom right of the screen to make a straight, top-down view.
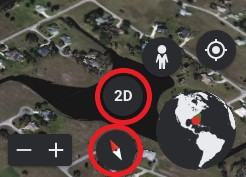
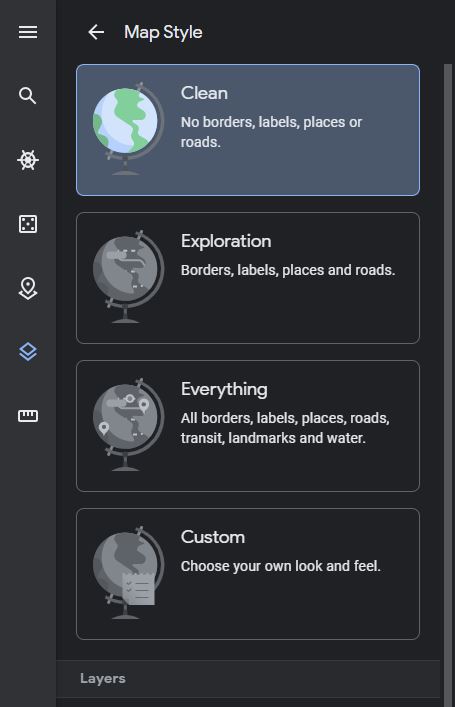
- If there are other locations/businesses marked in the view, click on the map style icon on the left side of the screen

- and then choose Clean for the map style
- Use the Windows Snipping Tool to take a screen capture from one marker to the other, and save the capture as a jpeg
- In the WinDarab GPS data plot, set the capture of the map as the background
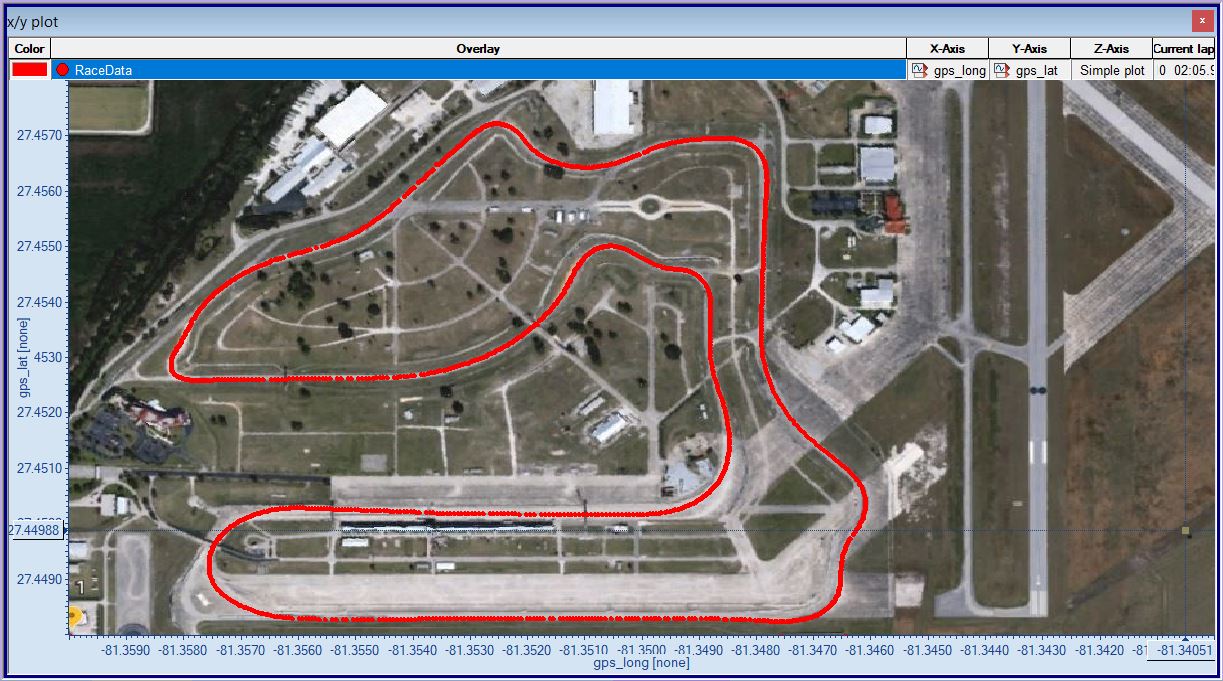
Note: If the GPS data does not show up well on map, the size and color of the points can be adjusted.