XY-Plot
In a (x, y) graph coordinates are calculated for a pair of values (x, y) in two channels (x- and y-axis).
This type of function allows you to determine very quickly which (x, y) pairs occur frequently as these tend to show up as a dense, cloud-like accumulation of dots.
A (x, y)-Plot window can display multiple (x, y)-Plots that are bound to different axes. This way it is very easy to compare the results of different (x, y) graphs.
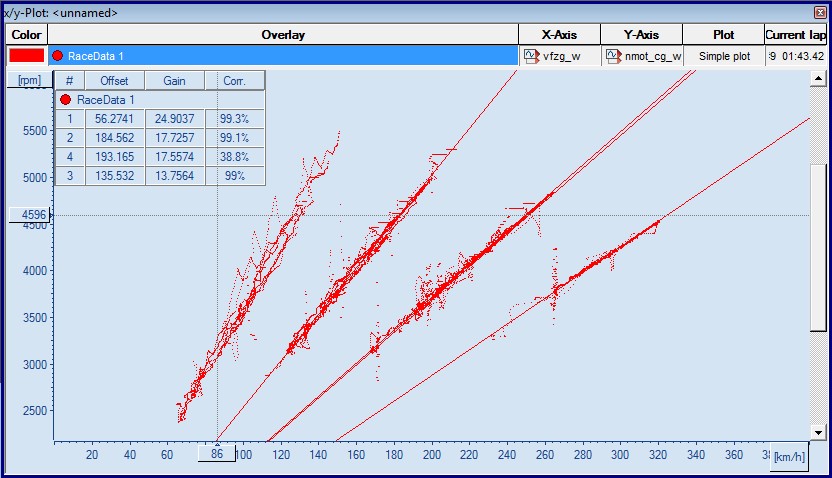
In addition each (x, y)-Plot can be used to separate the clouds in components and then to find the regression line for every component. Also for every component the correlation of dots inside is found. You can also add your own (user) lines for comparison. In the next figure you can see 4 components and 4 regression lines which correspond to the gears of the car. There is also one user line indicated by the two movable handles (displayed as dots on the line).
Open x/y plot
Drag "Start/Worksheet controls/x-y-plot" into your workspace to open the (x, y)-Plot Window.
Middle Mouse Click (Left Button + Right Button)
Clicking your middle mouse button (or left + right mouse buttons) displays a local menu (context menu) with options.
Calculations
Calculations are started after changes in the settings are made, or after “Update View” from the menu was clicked.
Because calculations can take much time especially if the range is above the whole file, they are made inside of another thread and you will see a progress bar in this case. Instead of waiting for them you can work in some other windows.
For online files calculations are started automatically after changing the range (new samples have been received) and the view will be updated too. The cross will be moved to the last drawn dot.